Dalam rangka menjaga stabilitas performa suatu layanan, baik pada level server maupun network perlu di pantau agar dapat mengetahui apabila ada suatu kejadian yang tidak terduga, sehingga kita dapat segera untuk melakukan solving terkait dari permasalahan tersebut
pada artikel ini menunjukan bagaimana installasi atau deployment monitoring menggunakan Grafana sebagai dashboard yang dipadukan dengan metricbeat sebagai agent pada host yang akan di monitoring dan elasticsearch sebagai collector metricnya.
tutorial ini menggunakan Ubuntu 20.04
Install On Host
Install Metricbeat
$ wget -qO - https://artifacts.elastic.co/GPG-KEY-elasticsearch | sudo apt-key add -

$ sudo apt-get install apt-transport-https

$ echo "deb <https://artifacts.elastic.co/packages/7.x/apt> stable main" | sudo tee -a /etc/apt/sources.list.d/elastic-7.x.list

$ sudo apt-get update && sudo apt-get install metricbeat
	$ nano /etc/metricbeat/metricbeat.yml

#===============  Modules configuration ============================
metricbeat.config.modules:
  # Glob pattern for configuration loading
  path: ${path.config}/modules.d/*.yml
----
----
metricbeat.modules:
- module: system
  metricsets:
    - cpu             # CPU usage
    - load            # CPU load averages
    - memory          # Memory usage
    - network         # Network IO
    - process         # Per process metrics
    - process_summary # Process summary
    - uptime          # System Uptime
    - socket_summary  # Socket summary
    - core            # Per CPU core usage
    - diskio          # Disk IO
    - filesystem      # File system usage for each mountpoint
    - fsstat          # File system summary metrics
    - raid            # Raid
    - socket          # Sockets and connection info (linux only)
  enabled: true
  period: 10s
  processes: ['.*']

-----
-----
# ---------------------------- Elasticsearch Output ----------------------------
output.elasticsearch:
  # Array of hosts to connect to.
  hosts: ["<IP_Monitor_Host>:9200"]
$ systemctl start metricbeat
$ systemctl status metricbeat
$ systemctl enable metricbeat
$ metricbeat modules enable elasticsearch
Install on Monitor Host
instal elasticsearch
$ wget -qO - https://artifacts.elastic.co/GPG-KEY-elasticsearch | sudo apt-key add -

$ sudo apt-get install apt-transport-https

$ echo "deb <https://artifacts.elastic.co/packages/7.x/apt> stable main" | sudo tee -a /etc/apt/sources.list.d/elastic-7.x.list

$ sudo apt-get update && sudo apt-get install elasticsearch
$ sudo systemctl daemon-reload

$ sudo systemctl enable elasticsearch.service

$ sudo systemctl start elasticsearch.service

$ sudo systemctl stop elasticsearch.service
    $ nano /etc/elasticsearch/elasticsearch.yml

# ---------------------------------- Network ----------------------
# Set the bind address to a specific IP (IPv4 or IPv6):
#
**network.host: 0.0.0.0
----
----
# -------------------------- Discovery ----------------------------
#
# Pass an initial list of hosts to perform discovery when this node is started:
# The default list of hosts is ["127.0.0.1", "[::1]"]
#
discovery.seed_hosts: ["0.0.0.0", "host2"]**
$ sudo systemctl restart elasticsearch.service
to verify:
<http://publicIP:9200/>

Response:
{
  "name" : "ip-172-31-38-154.eu-central-1.compute.internal",
  "cluster_name" : "elasticsearch",
  "cluster_uuid" : "Vc0JKivOT1ixD3bN4W3sZA",
  "version" : {
    "number" : "7.4.0",
    "build_flavor" : "default",
    "build_type" : "rpm",
    "build_hash" : "22e1767283e61a198cb4db791ea66e3f11ab9910",
    "build_date" : "2019-09-27T08:36:48.569419Z",
    "build_snapshot" : false,
    "lucene_version" : "8.2.0",
    "minimum_wire_compatibility_version" : "6.8.0",
    "minimum_index_compatibility_version" : "6.0.0-beta1"
  },
  "tagline" : "You Know, for Search"
}
install Grafana:
$ wget -q -O - <https://packages.grafana.com/gpg.key> | sudo apt-key add -

$ echo "deb <https://packages.grafana.com/oss/deb> stable main" | sudo tee -a /etc/apt/sources.list.d/grafana.list

$ sudo apt-get update && sudo apt-get install grafana
$ systemctl daemon-reload

$ systemctl start grafana-server

$ systemctl status grafana-server

$ sudo systemctl enable grafana-server.service
Now we can access grafana http://ServerIP:3000/
login page:
login page
Default username= “admin” and password=”admin” for grafana, once you login it will ask to change the password.
- installation of grafana
- create your first data source.
when you click on create your first data source it will take you to Add data source page.
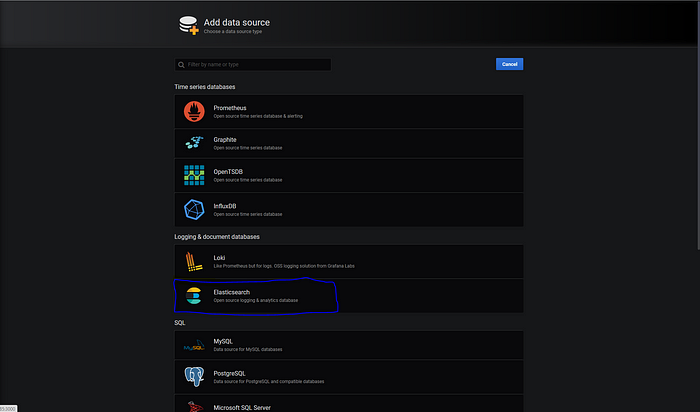
Select Elasticsearch as our data source. it will take to Data Sources / Elasticsearch page where we provide our elasticsearch URL,index name and elasticsearch version**.**
#HTTP
URL <http://localhost:9200>
-----
#Elasticsearch details
Index Name metricbeat-*
version 7.0+

If all configuration are correct you will get below message.

Now you can start creating your first dashboard.
If all configuration are correct you will get below message.
Now you can start creating your first dashboard.

Terimakasih telah berkomentar
EmoticonEmoticon